Explore Data


Add a location


Explore and learn more about federal sales


New York $2,298


Texas $10,099,709


Less than $100,000
$100,000 - $999,999
$1 million - $499 milion
$500 million - $1 billion
More than $1 billion


RVLA
Less than $100,000
$100,000 - $999,999
$1 million - $50 milion
$50 million - $100 mllion
More than $100 million

CY 2020
RVLA over time

(2013-2023)
$3.5 billion
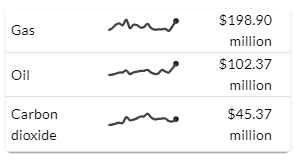
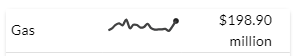
Gas
Oil
NGL
Total Commodities: 3


CY 2020
$3.5 billion
Gas
Oil
NGL
Total Commodities: 3

CY 2020
$2.5 billion
Gas
Oil
NGL
Total Commodities: 3
RVLA over time
(2013-2023)
CY 2020
Trend
(2013-2023)
$3.5 billion
RVLA
Gas
Oil
NGL
Total Commodities: 3
CY 2020
Trend
(2013-2023)
$2.5 billion
RVLA
Gas
Oil
NGL
Total Commodities: 3

CY 2020
RVLA over time
(2013-2023)
$10.8 million
Gas
Oil
NGL
Total Commodities: 3
CY 2020
Trend
(2013-2023)
$3.5 billion
RVLA
Gas
Oil
NGL
Total Commodities: 3
CY 2020
Trend
(2013-2023)
$2.5 billion
RVLA
Gas
Oil
NGL
Total Commodities: 3
CY 2020
Trend
(2013-2023)
$10.8 million
RVLA
Gas
Oil
NGL
Total Commodities: 3

CY 2020
RVLA over time
(2013-2023)
$500,000
Oil
Total Commodities: 1
CY 2020
RVLA over time
(2013-2023)
$3.5 billion
Gas
Oil
NGL
Total Commodities: 3
CY 2020
RVLA over time
(2013-2023)
$2.5 billion
Gas
Oil
NGL
Total Commodities: 3
CY 2020
RVLA over time
(2013-2023)
$10.8 million
Gas
Oil
NGL
Total Commodities: 3
CY 2020
RVLA over time
(2013-2023)
$500,000
Oil
Total Commodities: 1
CY 2020
Trend
(2013-2023)
$3.5 billion
RVLA
Gas
Oil
NGL
Total Commodities: 3
CY 2020
Trend
(2013-2023)
$2.5 billion
RVLA
Gas
Oil
NGL
Total Commodities: 3
CY 2020
Trend
(2013-2023)
$10.8 million
RVLA
Gas
Oil
NGL
Total Commodities: 3
Oil
Total Commodities: 1
Nevada did not have gas sales from 2013-2022

CY 2020
RVLA over time
(2013-2023)
$2.2 billion
Gas
Oil
NGL
Total Commodities: 3

CY 2020
RVLA over time
(2013-2023)
$1.9 billion
Gas
Oil
NGL
Total Commodities: 3

CY 2020
RVLA over time
(2013-2023)
$9.8 million
Gas
Oil
NGL
Total Commodities: 3

Oil
Total Commodities: 1
Nevada did not have gas sales from 2013-2022


Compare federal sales
Add up to four locations to compare. Select states and offshore regions.


Commodities

Oil

Sales Volume

3,378,791,002 bbl


RVPA

$1,519,417
RVLA
$1,513,559

Gas

Sales Volume

3,378,791,002 MMBtu


RVPA

$5,172,395
RVLA
$4,983,777

NGL

Sales Volume

3,378,791,002 gal
RVPA
$508,477


RVLA

$507,310


$3,750,613,572
CY 2020
Royalty Value Less Allowances
RVLA over time
(2013-2022)
Allowances


Allowance Type

CY 2020

Transportation
$1,572,544,513

Processing
$136,778,988


Total

$1,900,538,180

$2,500,300,300
CY 2020
Royalty Value Less Allowances
RVLA over time
(2013-2022)
Allowances


Allowance Type
CY 2020
Transportation
$572,544,513
Processing
$36,778,988
Total
$900,538,180
$500,678
CY 2020
Royalty Value Less Allowances
RVLA over time
(2013-2022)
Allowances


Allowance Type
CY 2020
Transportation
$572,544,513
Processing
$36,778,988
Total
$900,538,180

Add a location
Add Nationwide Federal
Commodities
Oil

Sales Volume

1,378,791,002 bbl

RVPA

$1,312,412
RVLA
$1,310,559
Gas

Sales Volume

791,002 MMBtu

RVPA

$172,395
RVLA
$983,777

NGL

Sales Volume

91,002 gal
RVPA
$68,477
RVLA
$50,310
Commodities
Oil
Sales Volume
78,791,002 bbl
RVPA
$519,417
RVLA
$500,678
Gas
Sales Volume
0 MMBtu
RVPA
$0
RVLA
$0

NGL

Sales Volume

0 gal
RVPA
$0

RVLA

$0

Commodities
Oil

Sales Volume

3,378,791,002 bbl

RVPA

$2,000,910,559


RVLA

$1,900,910,559

$1,900,910,559
CY 2020
Royalty Value Less Allowances
RVLA over time
(2013-2022)
Allowances


Allowance Type
CY 2020
Transportation
$1,572,544,513
Total
$1,900,538,180

Commodities
Oil
Sales Volume
3,378,791,002 bbl
RVPA
$2,450,613,572
RVLA
$2,250,613,572
$2,250,613,572
CY 2020
Royalty Value Less Allowances
RVLA over time
(2013-2022)
Allowances

Allowance Type
CY 2020
Transportation
$1,572,544,513
Total
$1,900,538,180

Commodities
Oil
Sales Volume
78,791,002 bbl
RVPA
$490,678


RVLA

$500,678
$500, 678
CY 2020
Royalty Value Less Allowances
RVLA over time
(2013-2022)
Allowances

Allowance Type
CY 2020
Transportation
$1,572,544,513
Total
$1,900,538,180

Add a location
Add Nationwide Federal


2014
Nevada: $3,066,054 ; $3,062,995
Nationwide Federal: $7,169,225,594 ; $7,030,220,893
Gulf of Mexico: $5,245,119,053 ; $5,125,842,914
Montana: $27,234,940 ; $26,887,559
RVPA ; RVLA

Commodity
Nevada


RVPA
RVLA
Nationwide Federal


RVPA
RVLA
Gulf of Mexico


RVPA
RVLA
Montana


RVPA
RVLA


Gulf of Mexico
$2,796,573,983

New Mexico
$1,551,546,250

Wyoming
$655,203,178

North Dakota
$282,922,540.38

Colorado
$117,361,174


Location name

Total


Gulf of Mexico

$2,796,573,983.96


New Mexico

$1,551,546,250.08


Wyoming

$655,203,178.63


North Dakota

$282,922,540.38


Colorado

$117,361,174.47


Utah

$85,742,680.13

Utah
$85,742,680
State/Offshore Region
Total

Gulf of Mexico

$2,796,573,983

42.8%
New Mexico
$1,551,546,250
10.8%
Wyoming
$655,203,178
4.1%
North Dakota
$282,922,540
1.5%
Colorado
$117,361,174
.75%
Utah
$85,742,680
.7%
California
$75, 82, 834
.65%
Arkansas
$52,846,834
.51%
Pacific
$48,763,562
.5%
Alaska
$46,060,159
.48%
Montana
$18,905,605
.3%
Oklahoma
$10,719,999
.25%
Texas
$10,099,709
.25%
Alaska OCS
$9,639,038
.22%
Louisiana
$8,536,994
.2%
Mississippi
$2,038,933
.05%
Nevada
$1,937,060
.03%
Kansas
$1,523,157
.03%
Ohio
$806,302
.02%
South Dakota
$744,690
.02%
Michigan
$394,481
.01%
Nebraska
$230,891
<.01%
Alabama
$180,638
<.01%
Illinois
$103,212
<.01%
Kentucky
$72,592
<.01%
Virginia
$34,257
<.01%
Pennsylvania
$21,546
<.01%
West Virginia
$19,268
<.01%
New York
$2,298
<.01%
Show Commodity Details


Commodity
Oil

Gas
NGL

Total

RVLA
$0

$2,298
$0

$2,298
Commodity
Oil
Gas
NGL
Total
RVLA
$123,456,789
$123,456,789
$123,456,789
$867,530,999
Commodity
Oil
Gas
NGL
Total
RVLA
$123,456,789
$123,456,789
$123,456,789
$867,530,999
Commodity
Oil
Gas
NGL
Total
RVLA
$123,456,789
$123,456,789
$123,456,789
$867,530,999
Commodity
Oil
Gas
NGL
Total
RVLA
$123,456,789
$123,456,789
$123,456,789
$867,530,999
Commodity
Oil
Gas
NGL
Total
RVLA
$123,456,789
$123,456,789
$123,456,789
$867,530,999
Commodity
Oil
Gas
NGL
Total
RVLA
$123,456,789
$123,456,789
$123,456,789
$867,530,999
Commodity
Oil
Gas
NGL
Total
RVLA
$123,456,789
$123,456,789
$123,456,789
$867,530,999
Commodity
Oil
Gas
NGL
Total
RVLA
$123,456,789
$123,456,789
$123,456,789
$867,530,999
Commodity
Oil
Gas
NGL
Total
RVLA
$123,456,789
$123,456,789
$123,456,789
$867,530,999
Commodity
Oil
Gas
NGL
Total
RVLA
$123,456,789
$123,456,789
$123,456,789
$867,530,999
Commodity
Oil
Gas
NGL
Total
RVLA
$123,456,789
$123,456,789
$123,456,789
$867,530,999
Commodity
Oil
Gas
NGL
Total
RVLA
$123,456,789
$123,456,789
$123,456,789
$867,530,999
Commodity
Oil
Gas
NGL
Total
RVLA
$123,456,789
$123,456,789
$123,456,789
$867,530,999
Commodity
Oil
Gas
NGL
Total
RVLA
$123,456,789
$123,456,789
$123,456,789
$867,530,999
Commodity
Oil
Gas
NGL
Total
RVLA
$123,456,789
$123,456,789
$123,456,789
$867,530,999
Commodity
Oil
Gas
NGL
Total
RVLA
$123,456,789
$123,456,789
$123,456,789
$867,530,999
Commodity
Oil
Gas
NGL
Total
RVLA
$123,456,789
$123,456,789
$123,456,789
$867,530,999
Commodity
Oil
Gas
NGL
Total
RVLA
$123,456,789
$123,456,789
$123,456,789
$867,530,999
Commodity
Oil
Gas
NGL
Total
RVLA
$123,456,789
$123,456,789
$123,456,789
$867,530,999
Commodity
Oil
Gas
NGL
Total
RVLA
$123,456,789
$123,456,789
$123,456,789
$867,530,999
Commodity
Oil
Gas
NGL
Total
RVLA
$123,456,789
$123,456,789
$123,456,789
$867,530,999
Commodity
Oil
Gas
NGL
Total
RVLA
$123,456,789
$123,456,789
$123,456,789
$867,530,999
Commodity
Oil
Gas
NGL
Total
RVLA
$123,456,789
$123,456,789
$123,456,789
$867,530,999
Commodity
Oil
Gas
NGL
Total
RVLA
$123,456,789
$123,456,789
$123,456,789
$867,530,999
Commodity
Oil
Gas
NGL
Total
RVLA
$123,456,789
$123,456,789
$123,456,789
$867,530,999
Commodity
Oil
Gas
NGL
Total
RVLA
$123,456,789
$123,456,789
$123,456,789
$867,530,999
Commodity
Oil
Gas
NGL
Total
RVLA
$123,456,789
$123,456,789
$123,456,789
$867,530,999

Gulf of Mexico

$2,796,573,983

42.8%
New Mexico
$1,551,546,250
10.8%
Wyoming
$655,203,178
4.1%
North Dakota
$282,922,540
1.5%
Colorado
$117,361,174
.75%
Utah
$85,742,680
.7%
California
$75, 82, 834
.65%
Arkansas
$52,846,834
.51%
Pacific
$48,763,562
.5%
Alaska
$46,060,159
.48%
Montana
$18,905,605
.3%
Oklahoma
$10,719,999
.25%
Texas
$10,099,709
.25%
Alaska OCS
$9,639,038
.22%
Louisiana
$8,536,994
.2%
Mississippi
$2,038,933
.05%
Nevada
$1,937,060
.03%
Kansas
$1,523,157
.03%
Ohio
$806,302
.02%
South Dakota
$744,690
.02%
Michigan
$394,481
.01%
Nebraska
$230,891
<.01%
Alabama
$180,638
<.01%
Illinois
$103,212
<.01%
Kentucky
$72,592
<.01%
Virginia
$34,257
<.01%
Pennsylvania
$21,546
<.01%
West Virginia
$19,268
<.01%
New York
$2,298
<.01%


Hide Details

RVLA
$2,497,627,695
$219,479,375
$79,4666,912

$2,796,573,983

Commodity
Oil
Gas
NGL

Total


Nationwide federal sales summary (oil, gas, NGL)
The Office of Natural Resource Revenue (ONRR) collects the RVLA and the reported data from reporters/payors across federal lands. For calendar year 2020, ONRR collected $3,750,613,572 in RVLA on sales of oil, gas, and NGLs from federal lands.
Top nationwide locations (oil, gas, NGL)
Compare federal sales
Nationwide federal sales summary
Top nationwide locations
RVLA by location
Map


Royalty Value Less Allowances (RVLA)
Percent of Federal Total
Top 6 locations - RVLA
CY2020
Check RVLA by location for more locations
RVLA by location
Federal sales comparison and nationwide summaries

Compare federal sales
Add up to four locations to compare. Select states and offshore regions.
Commodities
Oil
Sales Volume
3,378,791,002 bbl
RVPA
$1,519,417
RVLA
$1,513,559
Gas
Sales Volume
3,378,791,002 MMBtu
RVPA
$5,172,395
RVLA
$4,983,777
NGL
Sales Volume
3,378,791,002 gal
RVPA
$508,477
RVLA
$507,310
$3,750,613,572
CY 2020
Royalty Value Less Allowances
RVLA over time
(2013-2022)
Allowances
Allowance Type
CY 2020
Transportation
$1,572,544,513
Processing
$136,778,988
Total
$1,900,538,180
$2,500,300,300
CY 2020
Royalty Value Less Allowances
RVLA over time
(2013-2022)
Allowances
Allowance Type
CY 2020
Transportation
$572,544,513
Processing
$36,778,988
Total
$900,538,180
$500,678
CY 2020
Royalty Value Less Allowances
RVLA over time
(2013-2022)
Allowances
Allowance Type
CY 2020
Transportation
$572,544,513
Processing
$36,778,988
Total
$900,538,180
Add a location
Add Nationwide Federal
Commodities
Oil
Sales Volume
1,378,791,002 bbl
RVPA
$1,312,412
RVLA
$1,310,559
Gas
Sales Volume
791,002 MMBtu
RVPA
$172,395
RVLA
$983,777
NGL
Sales Volume
91,002 gal
RVPA
$68,477
RVLA
$50,310
Commodities
Oil
Sales Volume
78,791,002 bbl
RVPA
$519,417
RVLA
$500,678
Gas
Sales Volume
0 MMBtu
RVPA
$0
RVLA
$0
NGL
Sales Volume
0 gal
RVPA
$0
RVLA
$0
Commodities
Oil
Sales Volume
3,378,791,002 bbl
RVPA
$2,000,910,559
RVLA
$1,900,910,559
$1,900,910,559
CY 2020
Royalty Value Less Allowances
RVLA over time
(2013-2022)
Allowances
Allowance Type
CY 2020
Transportation
$1,572,544,513
Total
$1,900,538,180
Commodities
Oil
Sales Volume
3,378,791,002 bbl
RVPA
$2,450,613,572
RVLA
$2,250,613,572
$2,250,613,572
CY 2020
Royalty Value Less Allowances
RVLA over time
(2013-2022)
Allowances
Allowance Type
CY 2020
Transportation
$1,572,544,513
Total
$1,900,538,180
Commodities
Oil
Sales Volume
78,791,002 bbl
RVPA
$490,678
RVLA
$500,678
$500, 678
CY 2020
Royalty Value Less Allowances
RVLA over time
(2013-2022)
Allowances
Allowance Type
CY 2020
Transportation
$1,572,544,513
Total
$1,900,538,180
Add a location
Add Nationwide Federal
2014
Nevada: $3,066,054 ; $3,062,995
Nationwide Federal: $7,169,225,594 ; $7,030,220,893
Gulf of Mexico: $5,245,119,053 ; $5,125,842,914
Montana: $27,234,940 ; $26,887,559
RVPA ; RVLA
Commodity
Nevada
RVPA
RVLA
Nationwide Federal
RVPA
RVLA
Gulf of Mexico
RVPA
RVLA
Montana
RVPA
RVLA
Gulf of Mexico
$2,796,573,983
New Mexico
$1,551,546,250
Wyoming
$655,203,178
North Dakota
$282,922,540.38
Colorado
$117,361,174
Location name
Total

Gulf of Mexico
$2,796,573,983.96
New Mexico
$1,551,546,250.08
Wyoming
$655,203,178.63
North Dakota
$282,922,540.38
Colorado
$117,361,174.47

Utah
$85,742,680.13
Utah
$85,742,680
State/Offshore Region
Total
Gulf of Mexico
$2,796,573,983
42.8%
New Mexico
$1,551,546,250
10.8%
Wyoming
$655,203,178
4.1%
North Dakota
$282,922,540
1.5%
Colorado
$117,361,174
.75%
Utah
$85,742,680
.7%
California
$75, 82, 834
.65%
Arkansas
$52,846,834
.51%
Pacific
$48,763,562
.5%
Alaska
$46,060,159
.48%
Montana
$18,905,605
.3%
Oklahoma
$10,719,999
.25%
Texas
$10,099,709
.25%
Alaska OCS
$9,639,038
.22%
Louisiana
$8,536,994
.2%
Mississippi
$2,038,933
.05%
Nevada
$1,937,060
.03%
Kansas
$1,523,157
.03%
Ohio
$806,302
.02%
South Dakota
$744,690
.02%
Michigan
$394,481
.01%
Nebraska
$230,891
<.01%
Alabama
$180,638
<.01%
Illinois
$103,212
<.01%
Kentucky
$72,592
<.01%
Virginia
$34,257
<.01%
Pennsylvania
$21,546
<.01%
West Virginia
$19,268
<.01%
New York
$2,298
<.01%
Show Commodity Details

Commodity
Oil
Gas
NGL
Total

RVLA
$0
$2,298
$0
$2,298
Commodity
Oil
Gas
NGL
Total
RVLA
$123,456,789
$123,456,789
$123,456,789
$867,530,999
Commodity
Oil
Gas
NGL
Total
RVLA
$123,456,789
$123,456,789
$123,456,789
$867,530,999
Commodity
Oil
Gas
NGL
Total
RVLA
$123,456,789
$123,456,789
$123,456,789
$867,530,999
Commodity
Oil
Gas
NGL
Total
RVLA
$123,456,789
$123,456,789
$123,456,789
$867,530,999
Commodity
Oil
Gas
NGL
Total
RVLA
$123,456,789
$123,456,789
$123,456,789
$867,530,999
Commodity
Oil
Gas
NGL
Total
RVLA
$123,456,789
$123,456,789
$123,456,789
$867,530,999
Commodity
Oil
Gas
NGL
Total
RVLA
$123,456,789
$123,456,789
$123,456,789
$867,530,999
Commodity
Oil
Gas
NGL
Total
RVLA
$123,456,789
$123,456,789
$123,456,789
$867,530,999
Commodity
Oil
Gas
NGL
Total
RVLA
$123,456,789
$123,456,789
$123,456,789
$867,530,999
Commodity
Oil
Gas
NGL
Total
RVLA
$123,456,789
$123,456,789
$123,456,789
$867,530,999
Commodity
Oil
Gas
NGL
Total
RVLA
$123,456,789
$123,456,789
$123,456,789
$867,530,999
Commodity
Oil
Gas
NGL
Total
RVLA
$123,456,789
$123,456,789
$123,456,789
$867,530,999
Commodity
Oil
Gas
NGL
Total
RVLA
$123,456,789
$123,456,789
$123,456,789
$867,530,999
Commodity
Oil
Gas
NGL
Total
RVLA
$123,456,789
$123,456,789
$123,456,789
$867,530,999
Commodity
Oil
Gas
NGL
Total
RVLA
$123,456,789
$123,456,789
$123,456,789
$867,530,999
Commodity
Oil
Gas
NGL
Total
RVLA
$123,456,789
$123,456,789
$123,456,789
$867,530,999
Commodity
Oil
Gas
NGL
Total
RVLA
$123,456,789
$123,456,789
$123,456,789
$867,530,999
Commodity
Oil
Gas
NGL
Total
RVLA
$123,456,789
$123,456,789
$123,456,789
$867,530,999
Commodity
Oil
Gas
NGL
Total
RVLA
$123,456,789
$123,456,789
$123,456,789
$867,530,999
Commodity
Oil
Gas
NGL
Total
RVLA
$123,456,789
$123,456,789
$123,456,789
$867,530,999
Commodity
Oil
Gas
NGL
Total
RVLA
$123,456,789
$123,456,789
$123,456,789
$867,530,999
Commodity
Oil
Gas
NGL
Total
RVLA
$123,456,789
$123,456,789
$123,456,789
$867,530,999
Commodity
Oil
Gas
NGL
Total
RVLA
$123,456,789
$123,456,789
$123,456,789
$867,530,999
Commodity
Oil
Gas
NGL
Total
RVLA
$123,456,789
$123,456,789
$123,456,789
$867,530,999
Commodity
Oil
Gas
NGL
Total
RVLA
$123,456,789
$123,456,789
$123,456,789
$867,530,999
Commodity
Oil
Gas
NGL
Total
RVLA
$123,456,789
$123,456,789
$123,456,789
$867,530,999
Commodity
Oil
Gas
NGL
Total
RVLA
$123,456,789
$123,456,789
$123,456,789
$867,530,999
Gulf of Mexico
$2,796,573,983
42.8%
New Mexico
$1,551,546,250
10.8%
Wyoming
$655,203,178
4.1%
North Dakota
$282,922,540
1.5%
Colorado
$117,361,174
.75%
Utah
$85,742,680
.7%
California
$75, 82, 834
.65%
Arkansas
$52,846,834
.51%
Pacific
$48,763,562
.5%
Alaska
$46,060,159
.48%
Montana
$18,905,605
.3%
Oklahoma
$10,719,999
.25%
Texas
$10,099,709
.25%
Alaska OCS
$9,639,038
.22%
Louisiana
$8,536,994
.2%
Mississippi
$2,038,933
.05%
Nevada
$1,937,060
.03%
Kansas
$1,523,157
.03%
Ohio
$806,302
.02%
South Dakota
$744,690
.02%
Michigan
$394,481
.01%
Nebraska
$230,891
<.01%
Alabama
$180,638
<.01%
Illinois
$103,212
<.01%
Kentucky
$72,592
<.01%
Virginia
$34,257
<.01%
Pennsylvania
$21,546
<.01%
West Virginia
$19,268
<.01%
New York
$2,298
<.01%
Hide Details
RVLA
$2,497,627,695
$219,479,375
$79,4666,912
$2,796,573,983

Commodity
Oil
Gas
NGL
Total
Nationwide federal sales summary (oil, gas, NGL)
The Office of Natural Resource Revenue (ONRR) collects the RVLA and the reported data from reporters/payors across federal lands. For calendar year 2020, ONRR collected $3,750,613,572 in RVLA on sales of oil, gas, and NGLs from federal lands.
Top nationwide locations (oil, gas, NGL)
Compare federal sales
Nationwide federal sales summary
Top nationwide locations
RVLA by location
Map
Percent of Federal Total
Check RVLA by location for more locations
RVLA by location
Explore Data

Add a location

2022
2013
2020
Select Year
Data Type
Commodity
Period
Calendar Year
Explore more Federal Sales


All

CY 2020
Trend
(2013-2023)
$2.5 billion
Gas
Oil
NGL
Total Commodities: 3

CY 2020
Trend
(2013-2023)
$10.8 million
Gas
Oil
NGL
Total Commodities: 3


CY 2020
RVLA over time
(2013-2023)
$3.5 billion
Gas
Oil
NGL
Total Commodities: 3
CY 2020
RVLA over time
(2013-2023)
$500,000
Oil
Total Commodities: 1


Less than $100,000
$100,000 - $999,999
$1 million - $499 milion
$500 million - $1 billion
More than $1 billion
Royalty Value Less Allowances (RVLA)


Federal Sales Data Glossary

This page includes some terms unique to this data set. Tap and hold to learn more.
CY 2020
Trend
(2013-2023)
$3.5 billion
Gas
Oil
NGL
Total Commodities: 3
CY 2020
Trend
(2013-2023)
$500,000
Oil
Total Commodities: 1
Less than $100,000
$100,000 - $999,999
$1 million - $499 milion
$500 million - $1 billion
More than $1 billion
Royalty Value Less Allowances (RVLA)
Royalty Valuation Prior to Allowances (RVPA)
Royalty Valuation Less Allowances (RVLA)
Offshore
Transportation Allowances
Processing Allowances


Federal Sales Data Glossary

Explore Data
Add a location
2022
2013
2020
Select Year
Data Type
Commodity
Period
Calendar Year


New York $2,298


Texas $10,099,709


Less than $100,000
$100,000 - $999,999
$1 million - $499 milion
$500 million - $1 billion
More than $1 billion


Less than $100,000
$100,000 - $999,999
$1 million - $499 milion
$500 million - $1 billion
More than $1 billion

CY 2020
RVLA over time
(2013-2023)
$3.5 billion
Gas
Oil
NGL
Total Commodities: 3


CY 2020
$3.5 billion
Gas
Oil
NGL
Total Commodities: 3

CY 2020
$2.5 billion
Gas
Oil
NGL
Total Commodities: 3
RVLA over time
(2013-2023)

CY 2020
Trend
(2013-2023)
$3.5 billion
RVLA
Gas
Oil
NGL
Total Commodities: 3

CY 2020
Trend
(2013-2023)
$2.5 billion
RVLA
Gas
Oil
NGL
Total Commodities: 3
CY 2020
RVLA over time
(2013-2023)
$10.8 million
Gas
Oil
NGL
Total Commodities: 3
CY 2020
Trend
(2013-2023)
$3.5 billion
RVLA
Gas
Oil
NGL
Total Commodities: 3
CY 2020
Trend
(2013-2023)
$2.5 billion
RVLA
Gas
Oil
NGL
Total Commodities: 3
CY 2020
Trend
(2013-2023)
$10.8 million
RVLA
Gas
Oil
NGL
Total Commodities: 3
CY 2020
RVLA over time
(2013-2023)
$500,000
Oil
Total Commodities: 1
CY 2020
RVLA over time
(2013-2023)
$3.5 billion
Gas
Oil
NGL
Total Commodities: 3
CY 2020
RVLA over time
(2013-2023)
$2.5 billion
Gas
Oil
NGL
Total Commodities: 3
CY 2020
RVLA over time
(2013-2023)
$10.8 million
Gas
Oil
NGL
Total Commodities: 3
CY 2020
RVLA over time
(2013-2023)
$500,000
Oil
Total Commodities: 1
CY 2020
Trend
(2013-2023)
$3.5 billion
RVLA
Gas
Oil
NGL
Total Commodities: 3
CY 2020
Trend
(2013-2023)
$2.5 billion
RVLA
Gas
Oil
NGL
Total Commodities: 3
CY 2020
Trend
(2013-2023)
$10.8 million
RVLA
Gas
Oil
NGL
Total Commodities: 3
Oil
Total Commodities: 1
Nevada did not have gas sales from 2013-2022
CY 2020
RVLA over time
(2013-2023)
$2.2 billion
Gas
Oil
NGL
Total Commodities: 3
CY 2020
RVLA over time
(2013-2023)
$1.9 billion
Gas
Oil
NGL
Total Commodities: 3
CY 2020
RVLA over time
(2013-2023)
$9.8 million
Gas
Oil
NGL
Total Commodities: 3
Oil
Total Commodities: 1
Nevada did not have gas sales from 2013-2022
All
Royalty Value Less Allowances (RVLA)
Federal sales comparison and nationwide summaries
Federal Sales Data Glossary
This page includes some terms unique to this data set. Hover over the terms to learn more.
Royalty Valuation Prior to Allowances (RVPA)
Royalty Valuation Less Allowances (RVLA)
Offshore
Transportation Allowances
Processing Allowances
Federal Sales Data Glossary

CY2020
Query nationwide federal sales

2022
2013
2020
Select Year
Data Type
Commodity
Period
Calendar Year
All
Federal Sales Data Glossary
This page includes some terms unique to this data set. Hover over to learn more.
Royalty Valuation Prior to Allowances (RVPA)
Royalty Valuation Less Allowances (RVLA)
Onshore
Offshore
Transportation Allowances
Processing Allowances
Federal Sales Data Glossary
Source file and documentation
About the data
The federal sales dataset is limited to sales for oil, gas, and NGLs on federal lands (onshore) and federal water (offshore).
Data dictionary
Query federal sales data
Explore and learn more about federal sales
Top 6 locations - RVLA
CY2020
CY2020